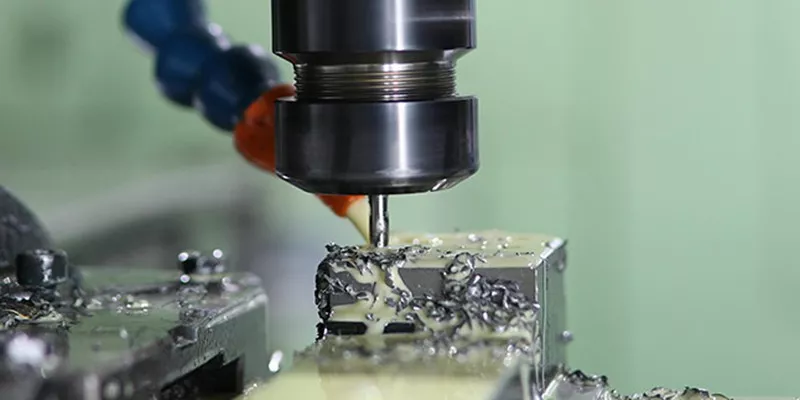
In industrial manufacturing, achieving the optimal surface roughness has always been an important challenge. The complexity of machinery and the differences in material properties can make surface quality control more difficult. In real projects, engineers and procurement teams often need to balance cost efficiency with quality standards. Without clear process judgment, the final machining results may fall short of expectations.
For projects that require stable surface quality and precise machining control, YPMFG can help evaluate suitable machining solutions based on material properties, part application, and tolerance requirements, achieving a better balance between cost, efficiency, and surface finish quality.
Reader Benefit
Understanding the Surface Roughness Chart is essential for engineers and procurement officers aiming to streamline manufacturing processes. By leveraging this guide, you can better predict and manage surface roughness, thus reducing material waste and operational costs while enhancing product quality.
Article Promise
This guide provides a comprehensive overview of the Surface Roughness Chart, equipping you with the data-driven insights necessary to make informed decisions. We’ll delve into ten critical aspects, ensuring you grasp the essential elements to achieve a competitive edge.
1. Understanding Surface Roughness
Surface roughness refers to the microscopic texture of a material’s surface, which can be measured using specialized instruments. It’s crucial for determining the quality of machined parts and is often represented in the Surface Roughness Chart.
Key Graph
Figure 1: A typical Surface Roughness Profile graph showing various roughness parameters.
2. The Importance of Surface Roughness in Manufacturing
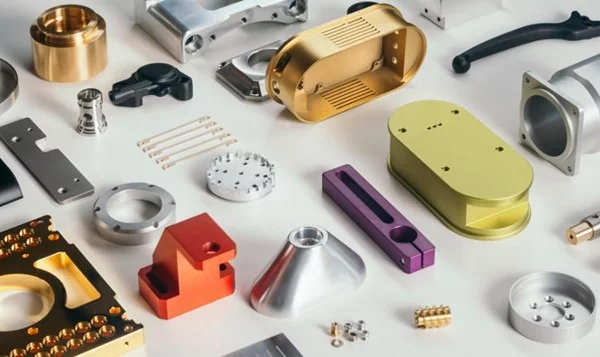
Surface roughness affects several aspects of product performance, including wear resistance, friction, and aesthetic quality. A Surface Roughness Chart can help visualize these impacts and guide manufacturing decisions.
Key Graph
Figure 2: Comparative analysis showing performance differences based on surface roughness levels.
3. How to Read a Surface Roughness Chart
A Surface Roughness Chart typically includes parameters such as Ra (Arithmetic Mean Roughness), Rz (Ten-point Height), and Rmax (Maximum Height of Irregularities). Understanding these parameters is vital for interpreting the chart.
Key Graph
Figure 3: A sample Surface Roughness Chart with annotated parameters.
4. Factors Influencing Surface Roughness
Several factors, including cutting tools, machining speeds, and material properties, influence surface roughness. Recognizing these factors can help in predicting and controlling roughness levels.
5. Surface Roughness Measurement Techniques
Various techniques, such as tactile, optical, and laser profiling, are used to measure surface roughness. Each method has its advantages and limitations.
6. Surface Roughness Standards and Specifications
Different industries have specific Surface Roughness Chart standards. Adhering to these standards ensures consistency and compliance with quality requirements.
7. The Role of Surface Roughness in Product Performance
Surface roughness impacts the longevity and functionality of products. For instance, smoother surfaces can reduce friction and enhance wear resistance, which is critical in automotive and aerospace applications.
8. Surface Roughness Optimization Strategies
To achieve optimal surface roughness, manufacturers often employ strategies like precision machining, advanced tooling, and automated control systems. At YP-MFG, we offer state-of-the-art equipment to ensure precise surface finishes.
9. Common Misconceptions About Surface Roughness
Many believe that smoother surfaces are always better. However, certain applications require a controlled amount of roughness to achieve specific performance characteristics.
10. Leveraging Surface Roughness Charts for Cost Reduction
By understanding and utilizing Surface Roughness Charts, manufacturers can reduce material waste and operational costs. Precise control over surface roughness allows for better material selection and process optimization.
FAQ
Q1: What is the standard unit for measuring surface roughness?
A1: Surface roughness is commonly measured in micrometers (µm) using parameters such as Ra, Rz, and Rmax.
Q2: How does surface roughness affect product lifespan?
A2: Smoother surfaces generally reduce friction and wear, thereby extending the product’s lifespan.
Q3: Can surface roughness be improved through post-processing?
A3: Yes, processes like polishing or electroplating can improve surface roughness after initial machining.
Q4: What role does surface roughness play in friction?
A4: Rougher surfaces increase friction, while smoother surfaces can reduce it, impacting the efficiency of moving parts.
Q5: Are there any environmental impacts of surface roughness?
A5: Excessive material removal due to poor surface control can lead to increased waste, impacting environmental sustainability.
If you want to optimize your manufacturing process through more precise surface roughness control, contact YPMFG for a free DFM analysis, project quote, or professional consultation.
YPMFG offers advanced machining equipment and precision manufacturing capabilities to help your parts meet higher surface quality standards. Reach out today to learn how better process planning and surface finish control can improve your overall manufacturing results.
This guide provides a more data-driven approach to surface roughness management, helping you use insights from Surface Roughness Charts to refine your manufacturing strategy and make more accurate process decisions.